Modern food production relies on multiple systems to manage planning, inventory, production, and quality, but these systems often operate in isolation. This makes it difficult to answer basic questions like: What can we realistically produce this week? Where are we losing efficiency? Was this batch profitable? In this article, we explore how connecting data from across the factory floor creates real-time visibility, better decision-making, and a real competitive edge.
Table of Contents
Transforming Data into Strategic Advantage
True organizational transformation occurs when data moves beyond mere collection to become a cornerstone of strategic decision-making. The shift happens when reliable current information flows seamlessly to those who need it most — the decision-makers who shape business outcomes.
This transformation requires 3 essential elements: unified system integration, analytics that directly address operational challenges, and insights delivered in formats that resonate with non-technical stakeholders. When these components work together, organizations can respond quickly to market changes, spot risks early, plan more effectively, use resources wisely, and reduce costs.
The path forward isn’t dependent on the newest technology — it demands a fundamental evolution in how leadership approaches information, turning data from a byproduct of operations into the foundation of competitive advantage.
How It Actually Works in Real Life
Picture this: It’s 7 AM at a food processing plant. The manager walks in with her coffee and pulls up a simple dashboard on her computer. Right there on the screen, she can see how all four production lines performed overnight — which ones hit their targets, where costs spiked, any customer complaints that came in, and exactly what caused any slowdowns.
In less than two minutes, she knows what needs her attention. By 7:15, she’s already texting the maintenance team about line three and calling a quick meeting about the packaging issue on line one.
Here’s the thing: you don’t need to completely overhaul your technology to make this happen. The real change is simpler but harder: deciding that your data should actually help people do their jobs better, not just sit in some database gathering digital dust.
A real case from OAL Group
When Premier Foods centralized production at its Ashford site, it needed full visibility and control across complex lines. By integrating SCADA automation with its ERP system, the company enabled real-time monitoring, automated recipe control, and streamlined reporting.
The impact was significant:
- 63% lower labour costs per tonne
- 38% fewer rejected batches
- 26% increase in throughput
This shows how data automation can reduce manual effort, improve quality, and drive efficiency—turning real-time insights into real business results.
Source: OAL Group

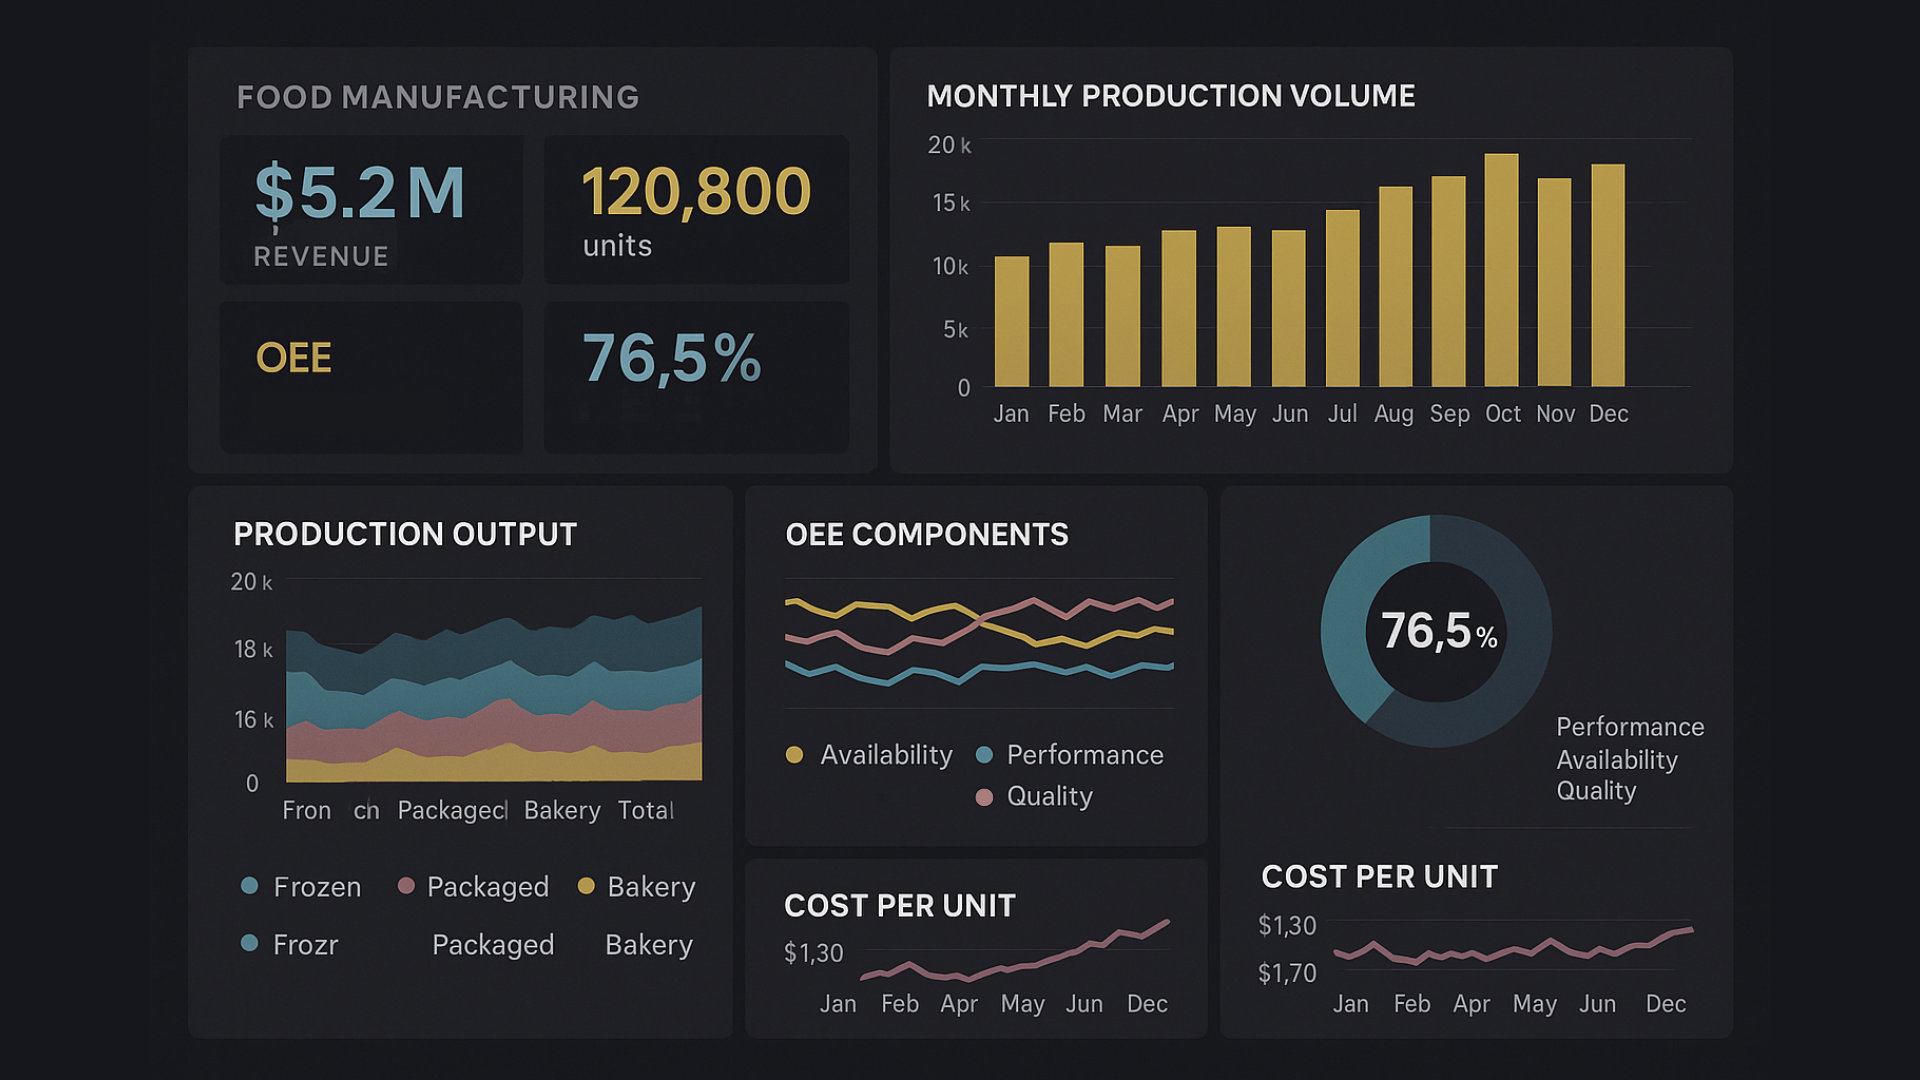
A high-level performance sample dashboard displaying total revenue, units produced, cost per unit, and Overall Equipment Effectiveness (OEE).
What Makes This Work?
Companies that succeed with data focus on these key elements:
- Assigning clear ownership of data accuracy,
- Establishing consensus on key business questions,
- Breaking down information silos between departments.
The transformation occurs when data moves beyond being an IT responsibility or finance function. When production teams, planners, quality managers, and sales staff all work with the same reliable information, decisions shift from intuition-based to evidence-based.
This alignment drives faster decision-making, more realistic planning, and better resource allocation across the organization.

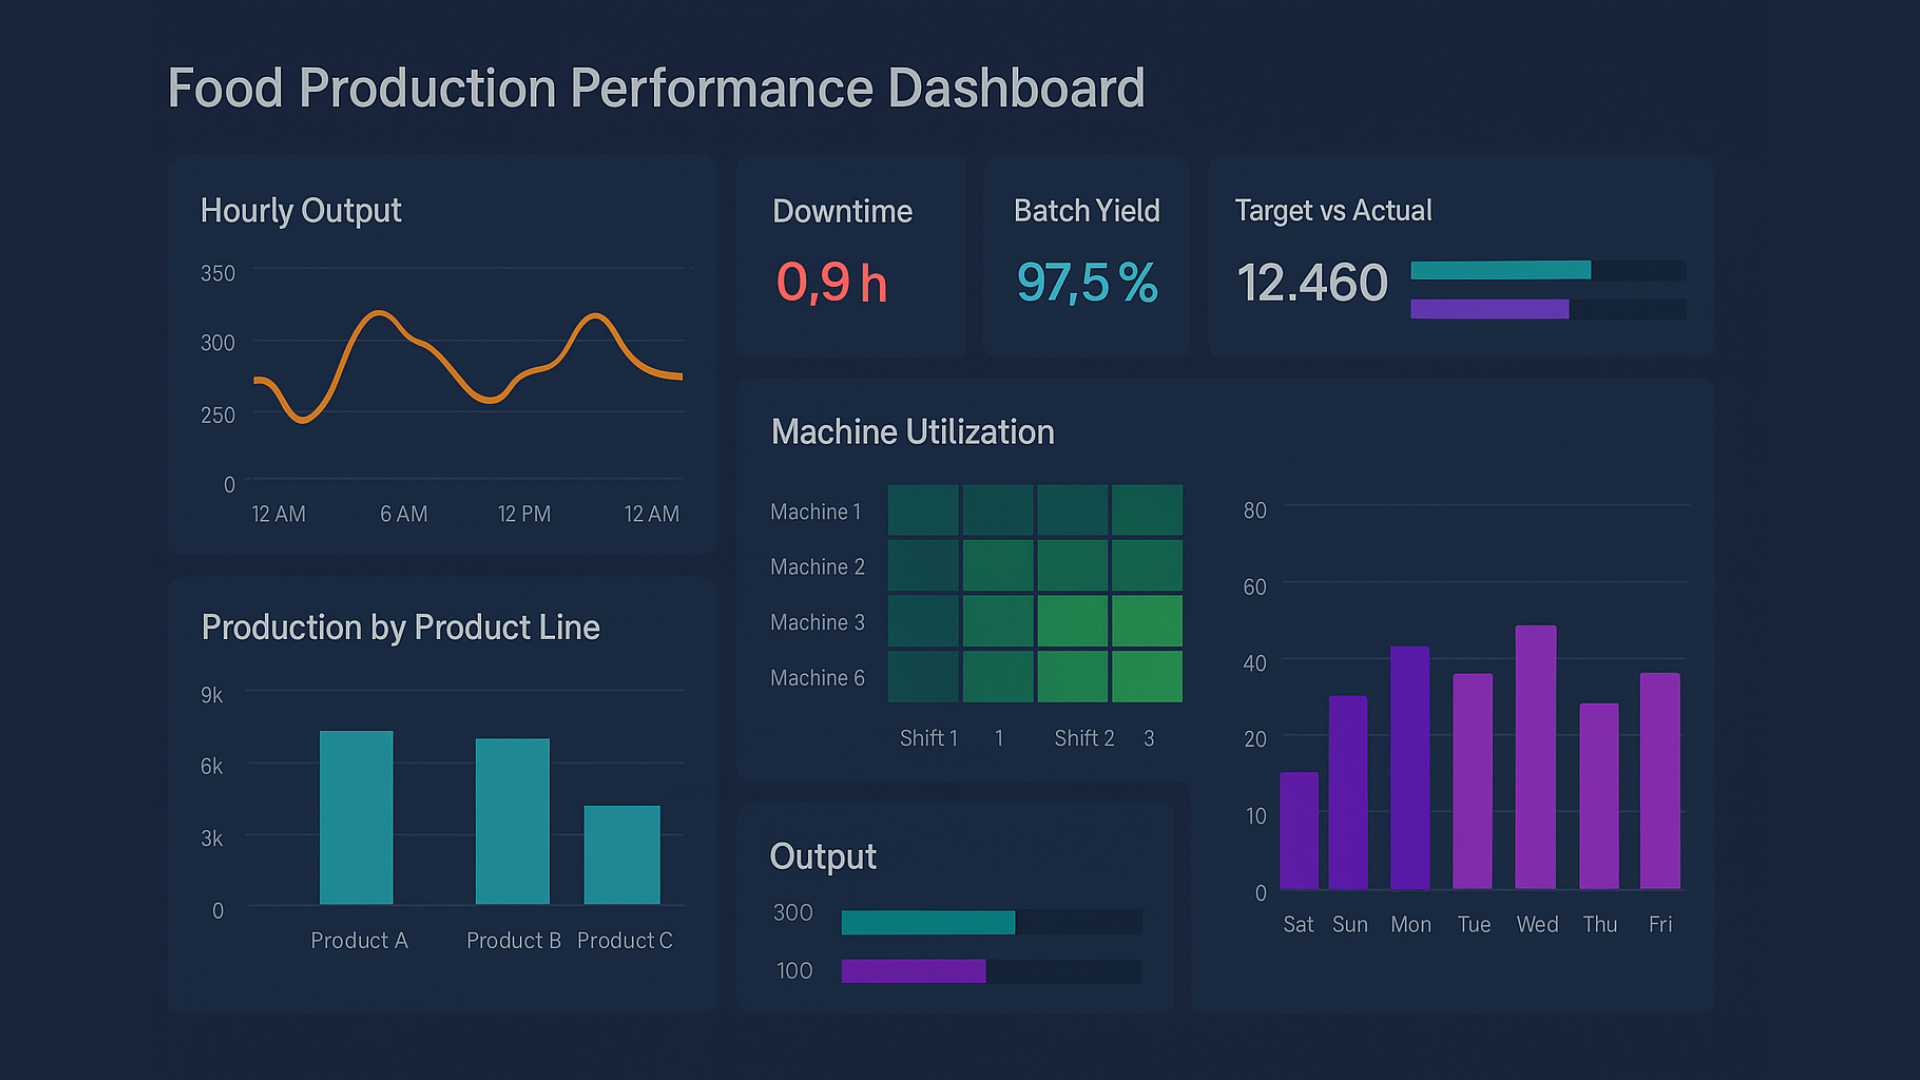
A sample operational dashboard focused on real-time metrics such as hourly output, machine utilization by shift, batch yield, downtime, and target vs. actual production.
5 Ways to Improve Data Visibility
1. In addition to system outputs, align dashboards with production shift rhythms.
Designing dashboards around ERP, MES, or WMS outputs is essential — but it’s not the full picture. Layer in real-world operational checkpoints like shift handovers, daily prep meetings, or packaging line resets. This ensures data shows up not just in the right system, but at the right moment for human decision-making.
2. Let production staff challenge the numbers.
If an operator or team leader spots a metric that “feels off,” treat it as a prompt for discovery. These observations often reveal system blind spots, integration flaws, or process drift that dashboards alone won’t catch.
3. Map one end-to-end process, then overlay metrics.
Pick a full workflow — from raw material intake to product dispatch — and walk it with stakeholders. Then overlay where data enters, where it’s missing, and where it gets interpreted. This often uncovers unspoken gaps between systems and roles.
4. Track “decisions taken with data,” not just dashboard views.
Viewing a report isn’t the same as acting on it. Highlight and document moments where data visibly changed a production plan, shift pattern, or quality action. These stories build internal trust in the system’s value.
5. Normalize small interventions instead of heroic fixes.
Data visibility works best in the everyday. Reinforce a culture where spotting a slight yield drop or adjusting line speed based on yesterday’s numbers is celebrated, not just big strategic overhauls.
How We Can Help
At Business Reporting Solutions, we help manufacturing companies build a truly data-driven culture. We connect information from various sources and systems, simplifying access, standardizing interpretation, and designing reports that answer real business questions.
We don’t just provide tools — we help shift the way people think. From intuitive decisions to informed ones, grounded in trustworthy analysis.
Every workday should start with one question:
“What do we need to know before the next production shift begins?”
If that answer isn’t readily available in your data, then your management process still has room to improve.
Data is one of your most valuable assets in an unpredictable world, it’s time to unlock its full potential.


