The telecommunications industry is built on facts. Network traffic, service levels (SLAs), and cost trends are visible in the data long before they appear in reports or presentations. A data-driven approach means treating performance, reliability, and costs as things you can measure — and letting those measurements guide how platforms are designed. In this article, we share our own experience from working with telecom projects in Azure — showing how data shaped our design choices and how decisions based on evidence led to better results.
Table of Contents
Make the platform measurable before you shape it
A Business Intelligence (BI) platform in telecommunications should be measurable from the very beginning. That’s why instrumentation comes first and design decisions come second — because clear metrics allow the system to evolve based on evidence rather than assumptions.
These metrics span across several areas. Performance is tracked through read/write throughput, queue latencies, batch execution times, and the efficiency of parallel processing. Reliability is measured by job success rates, recovery times after failures, and the freshness of delivered data. Costs are monitored through indicators such as price per terabyte processed, cost per report or query, idle run rates, and the balance of egress and ingress traffic. Finally, delivery workflows are assessed by looking at lead time for changes, deployment frequency, and rollback rates.
When combined, these measurements form release gates in Continuous Integration/Continuous Delivery (CI/CD) pipelines. If a change fails to meet the expected thresholds, it is either reworked or must be justified with clear data.
By defining these measurements early, telecommunications providers can shape BI platforms that scale predictably, remain cost-effective, and continuously improve.
Case #1 — Migration reality check: bigger Virtual Machines, slower pipelines
When we worked on a cloud migration project for one of our telecommunications clients, the expectation was simple: moving ETL (Extract, Transform, Load) pipelines from physical servers to larger, more powerful Microsoft Azure Virtual Machines should speed things up. The reality turned out quite different.
On the client’s on-premise infrastructure, SSD drives were plugged directly into the server motherboard, sustaining over 1 GB/s in read/write speed. In Azure, however, the managed disks available to the selected Virtual Machines reached only about 250 MB/s. Workloads that were already input/output (I/O) heavy on-premise became even more limited in the cloud.
To address this, we had to rethink how data was processed. Batch windows were reorganized, intermediate data compressed, and more transformations moved closer to the source systems to reduce unnecessary scans. In some cases, services were shifted into Platform as a Service (PaaS), where storage and compute resources were paired more efficiently. We also tuned pipeline parallelism to the actual throughput of the disks rather than the theoretical CPU capacity. Finally, benchmark gates were introduced so that any new configuration or SKU had to meet performance and cost targets before going live.
The financial lesson was just as important as the technical one. Options like redundancy levels, premium disk classes, or extra replicas may look harmless when chosen individually, but together they can easily add up to tens of thousands of euros annually. By designing around the slowest paid link and the billing boundaries, we brought performance back under control and stabilized costs.

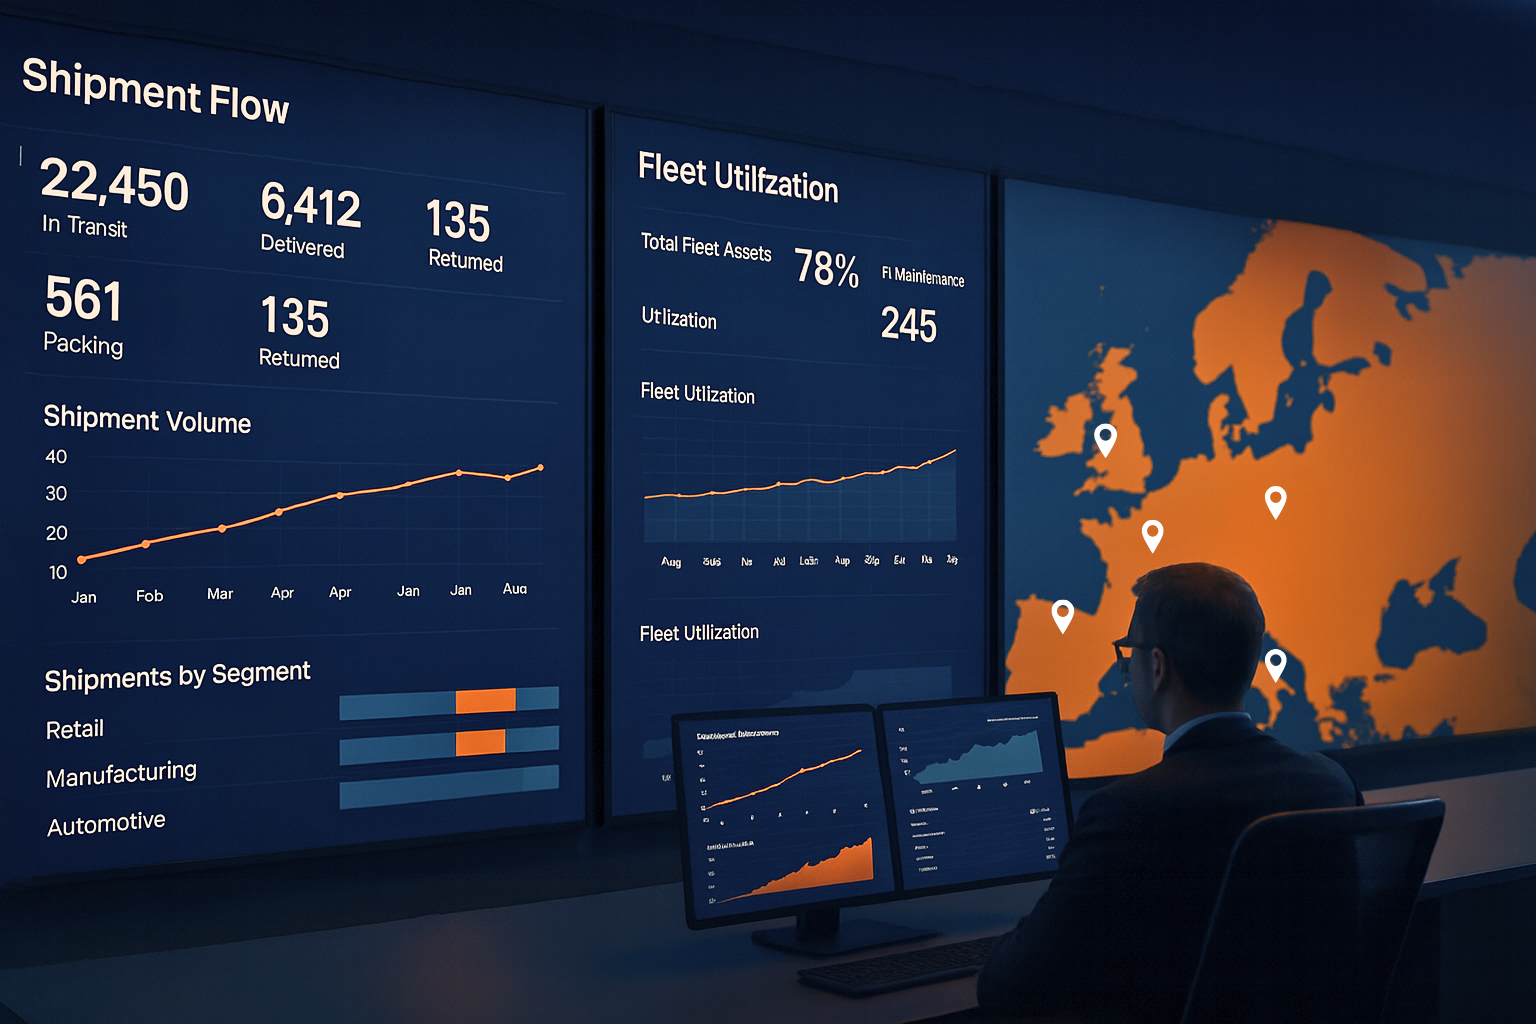
A sample dashboard with strategic KPIs for executives: subscribers, churn, revenue, EBITDA, and network availability
Principle: design to a billing model you can prove
In the cloud, pricing always reflects technical choices. Scalability works well up to a certain point, but beyond that costs rise quickly. The key is to validate assumptions with real numbers, not guesses. Financial Operations (FinOps) turns cost into analytics: resources are tagged, expenses are linked to specific business areas, and forecasts are based on actual workload patterns. Alerts highlight when the cost per unit of value starts to drift. In this way, price becomes just another dataset — tracked over time in euros per terabyte, per query, or per environment — making any change or regression visible and open to review.
Case #2 — Choosing the right foundation for a new data platform
Building a new data platform entirely in Azure gave us the opportunity to test several approaches before deciding on the right one. We compared Azure Synapse, Azure SQL Database, and SQL Server on Virtual Machines. Each option had strengths, but also limitations — Synapse was less flexible for our workload, high-tier Azure SQL Database delivered performance but at a high cost when multiplied across several environments, and SQL Server on VMs reintroduced management challenges we wanted to avoid.
Through experimentation, we discovered a setup that delivered both performance and cost efficiency. Operational data was processed using smaller Azure SQL Databases, which proved more economical, while reporting was supported by a curated star schema in Azure SQL Database. With automated scaling policies in place, the platform could expand resources during peak demand and reduce them close to zero during quiet hours.
The outcome was a modern BI environment that supported business growth, remained cost-effective, and ensured the client paid only for capacity actually used.

A sample dashboard with operational KPIs: network performance, tickets, bandwidth, and outage monitoring
The operating loop: decisions driven by data
Running a BI platform in telecommunications is not a one-time setup but a continuous process. Every change — whether it’s storage configuration, workload placement, or scaling policy — affects both cost and performance. That’s why decisions should always be based on measurement, not assumptions.
Dashboards and telemetry provide the feedback loop. They show when throughput or costs drift outside the target, when workloads can be shifted to cheaper tiers, or when quiet hours can be automated to save money. This way, teams can adapt quickly, roll back changes if needed, and keep the platform aligned with both performance and budget goals.
What this means for telco teams
For migration projects, it pays to recognize where throughput limits really are and design around them. For new builds, experimenting with different Azure services often reveals that multiple smaller, well-coordinated components can outperform one expensive “all-in-one” service.
Strong governance and automation are key. Without tagging, cost alerts, and budget checks built into delivery, spending tends to rise by default. With them, costs remain predictable and improvements achieved during migration or build-out are sustained over time.
How Business Reporting Solutions helps
At Business Reporting Solutions, we make sure data platforms deliver real business value. We help organizations design, build, and run BI environments that are reliable, scalable, and cost-effective. Our expertise covers the full data journey: from strategy and architecture, through reporting and automation, to ongoing support and optimization.
Most importantly, we work as a partner. Whether it’s a cloud migration, a new BI platform, or fine-tuning what’s already in place, our role is to help teams get the most out of their data.

Contact
Take your business to the next level with transparent business reporting
Choose a responsible partner with extensive experience who will provide real support for your team.