
When companies evaluate BI tools, they usually compare features: connectors, refresh speed, visualisation types and licensing. These are reasonable things to check. However, they’re also the wrong starting point. The question that determines whether a tool gets used daily or abandoned after the first quarter is simpler: Will your managers actually open it?
Table of Contents
Selection starts with decision routines
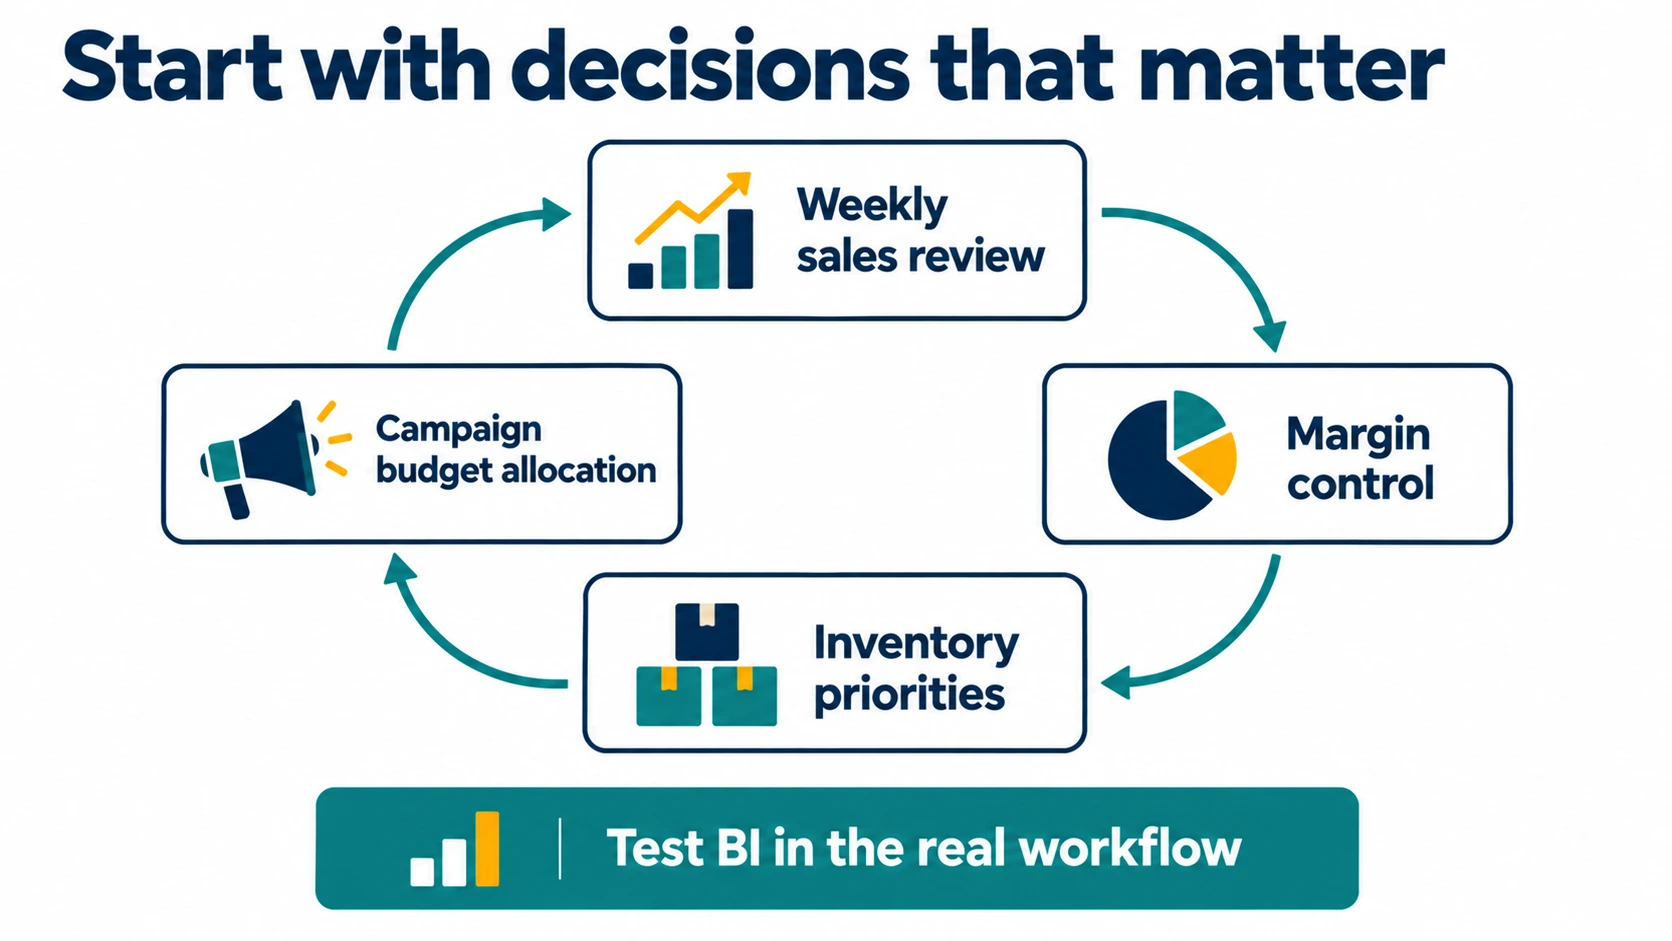
A useful selection process begins with one recurring decision that matters commercially. Weekly sales steering, margin control, inventory prioritisation, and campaign reallocation are common examples. When the decision is clear, tool evaluation becomes concrete. You can test whether the platform delivers trusted numbers on the right day, for the right audience, with clear drill-down paths.
This approach removes a lot of noise. Demo environments usually present ideal data and prebuilt dashboards. Real usage happens in messier conditions: source systems are inconsistent, definitions drift, and users need quick answers during meetings. A platform that holds up in those moments has a much higher chance of becoming part of the weekly workflow.
For context on how decision-support discipline has evolved, this article is a useful reference.
Data trust decides adoption faster than design quality
Users return to a BI platform when they trust metric logic. Attractive dashboards with weak definitions lose credibility quickly. Once teams start questioning numbers, they move back to manual reconciliation and private spreadsheets.
This is why governance — the roles, controls and processes used to manage data and analytical content — should be part of tool selection, not a follow-up workstream. Here, adoption means using BI effectively in everyday work.
Tableau guidance: shared responsibility between business and IT
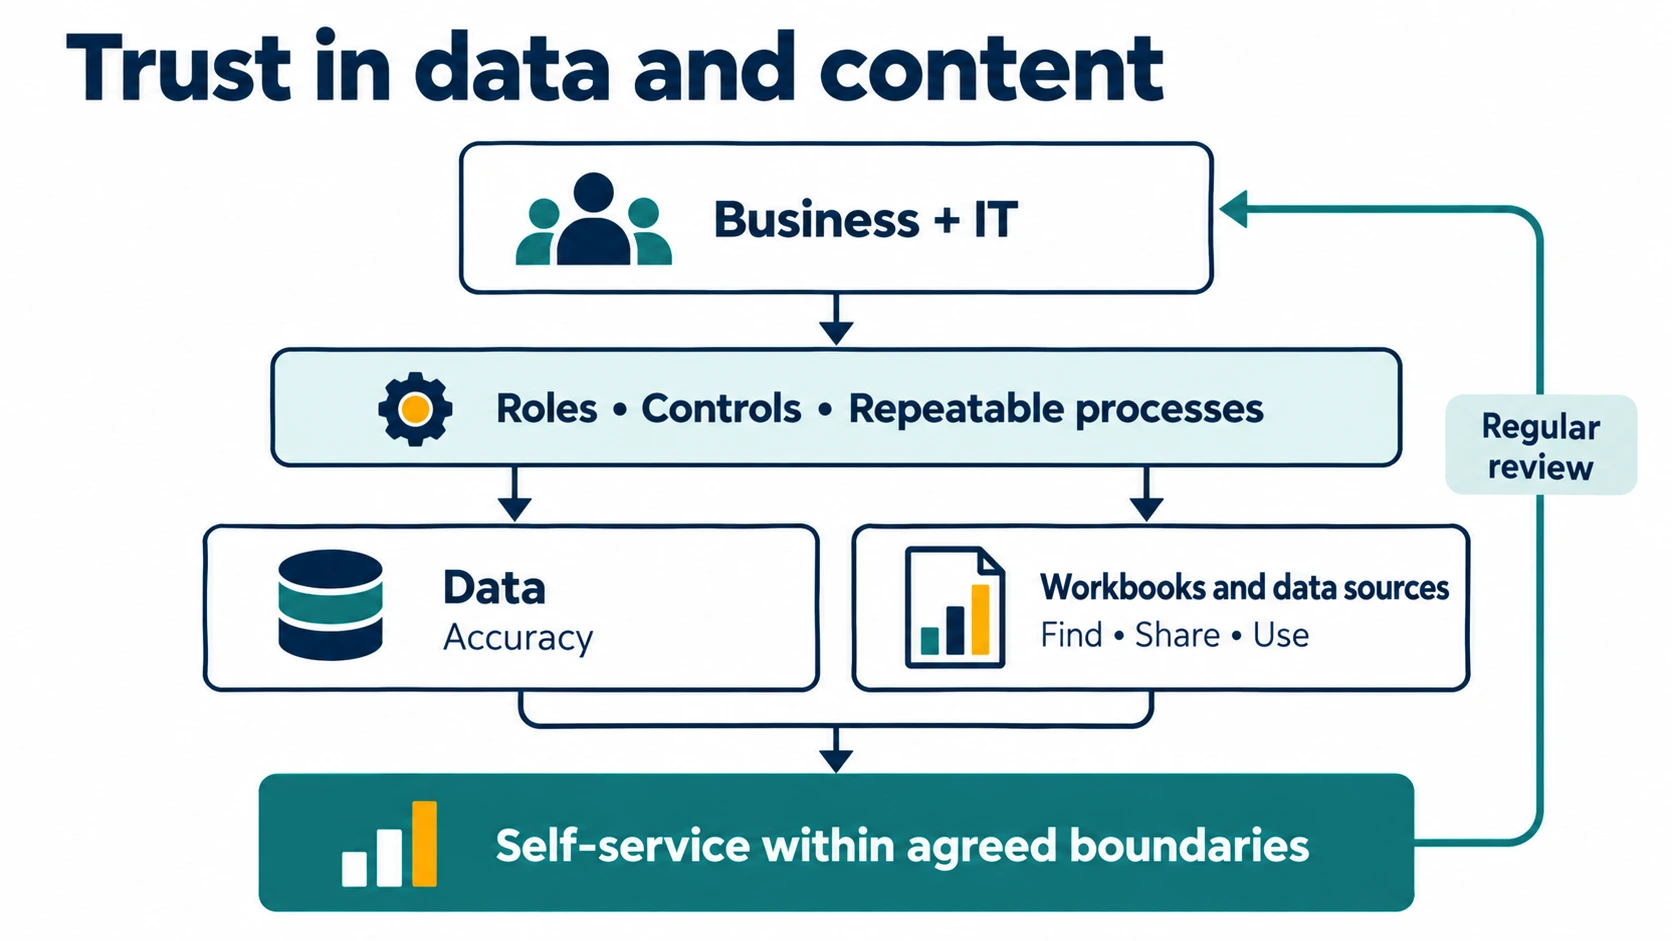
Tableau Blueprint recommends that business and IT jointly define roles, controls and repeatable processes. It distinguishes two areas:
- Data: ensuring its accuracy so that it can support decisions.
- Analytical content: helping users find, share and use the right workbooks and data sources.
Governance should enable self-service within agreed boundaries. Review it regularly and adapt it to new needs and user skills; defining it once at implementation is not enough.
Microsoft Fabric guidance: 12 areas of effective analytics adoption
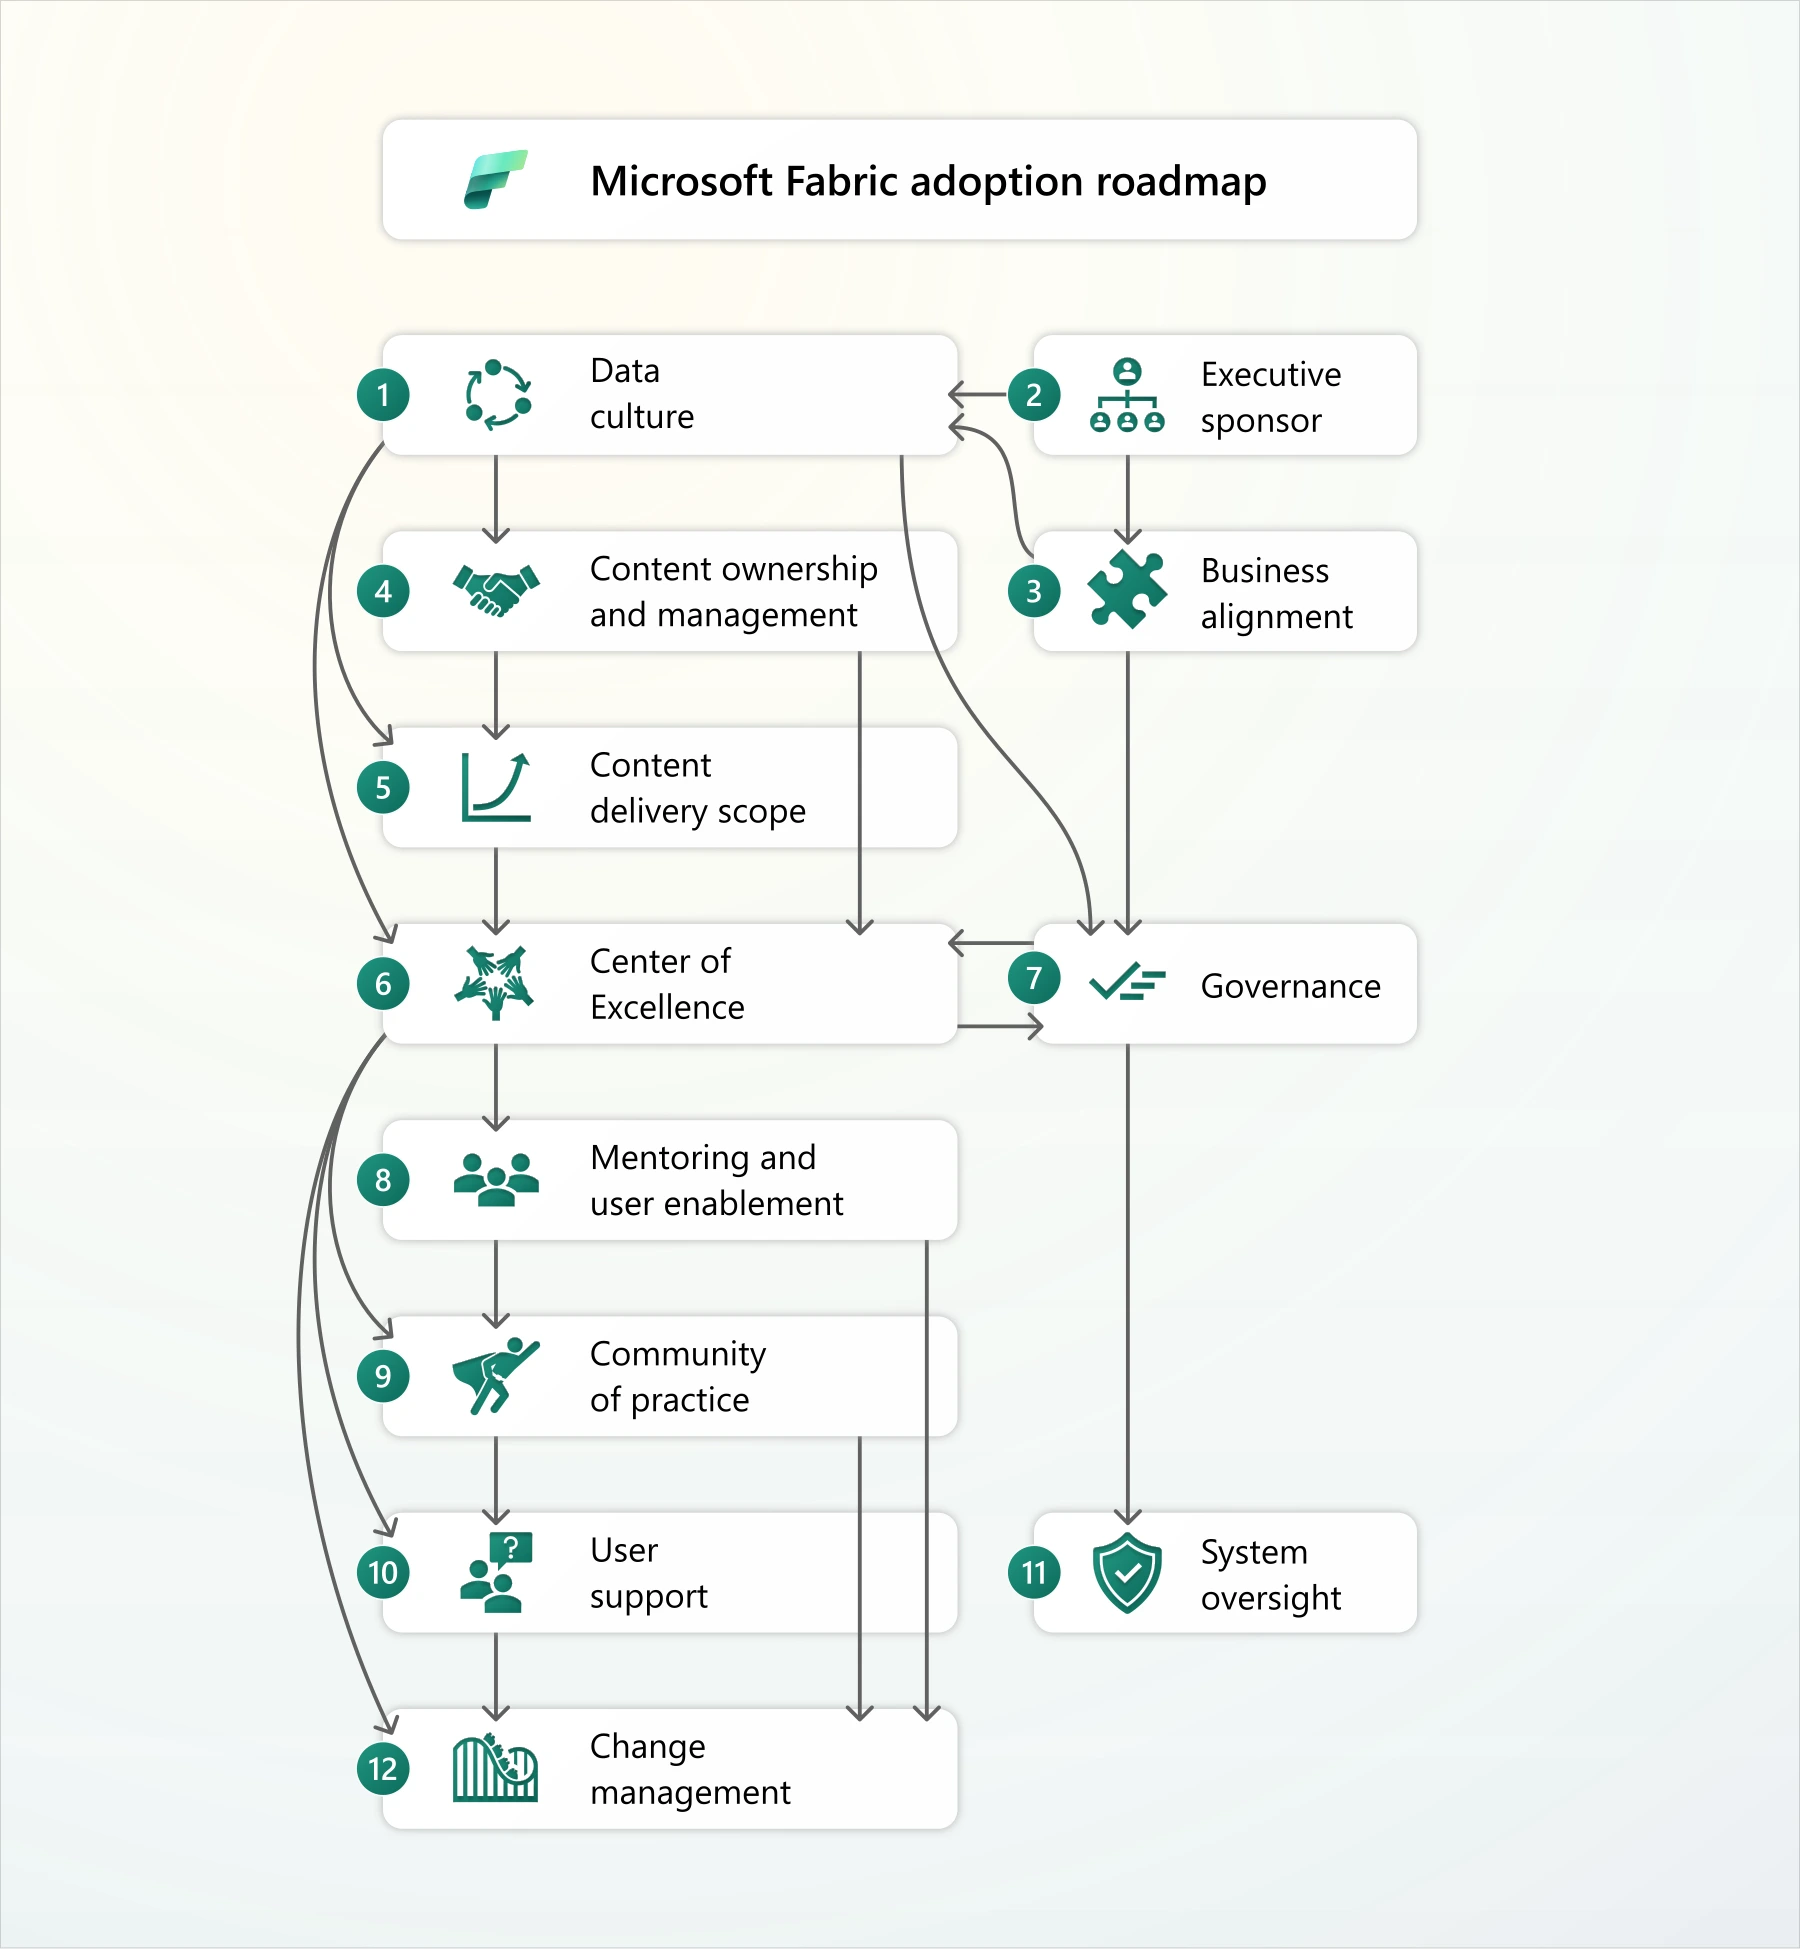
The Microsoft Fabric adoption roadmap covers the following areas:
- Direction: data culture, executive sponsorship and alignment between data strategy and business objectives.
- Ownership and governance: content ownership and management, content delivery scope, a Center of Excellence and governance.
- User development: mentoring and user enablement, a community of practice and user support.
- Continuity: system oversight and change management.
Data culture influences content ownership and delivery strategies, which in turn shape the Center of Excellence and governance. An executive sponsor helps align these activities with business objectives. Microsoft stresses that user and view counts alone do not establish adoption: the effectiveness of usage also matters.
In practical terms, selection teams should verify how each platform supports semantic consistency, access control, lifecycle management of reports, and change handling when business logic shifts. These capabilities influence daily trust much more than long feature checklists.
Define adoption before you buy
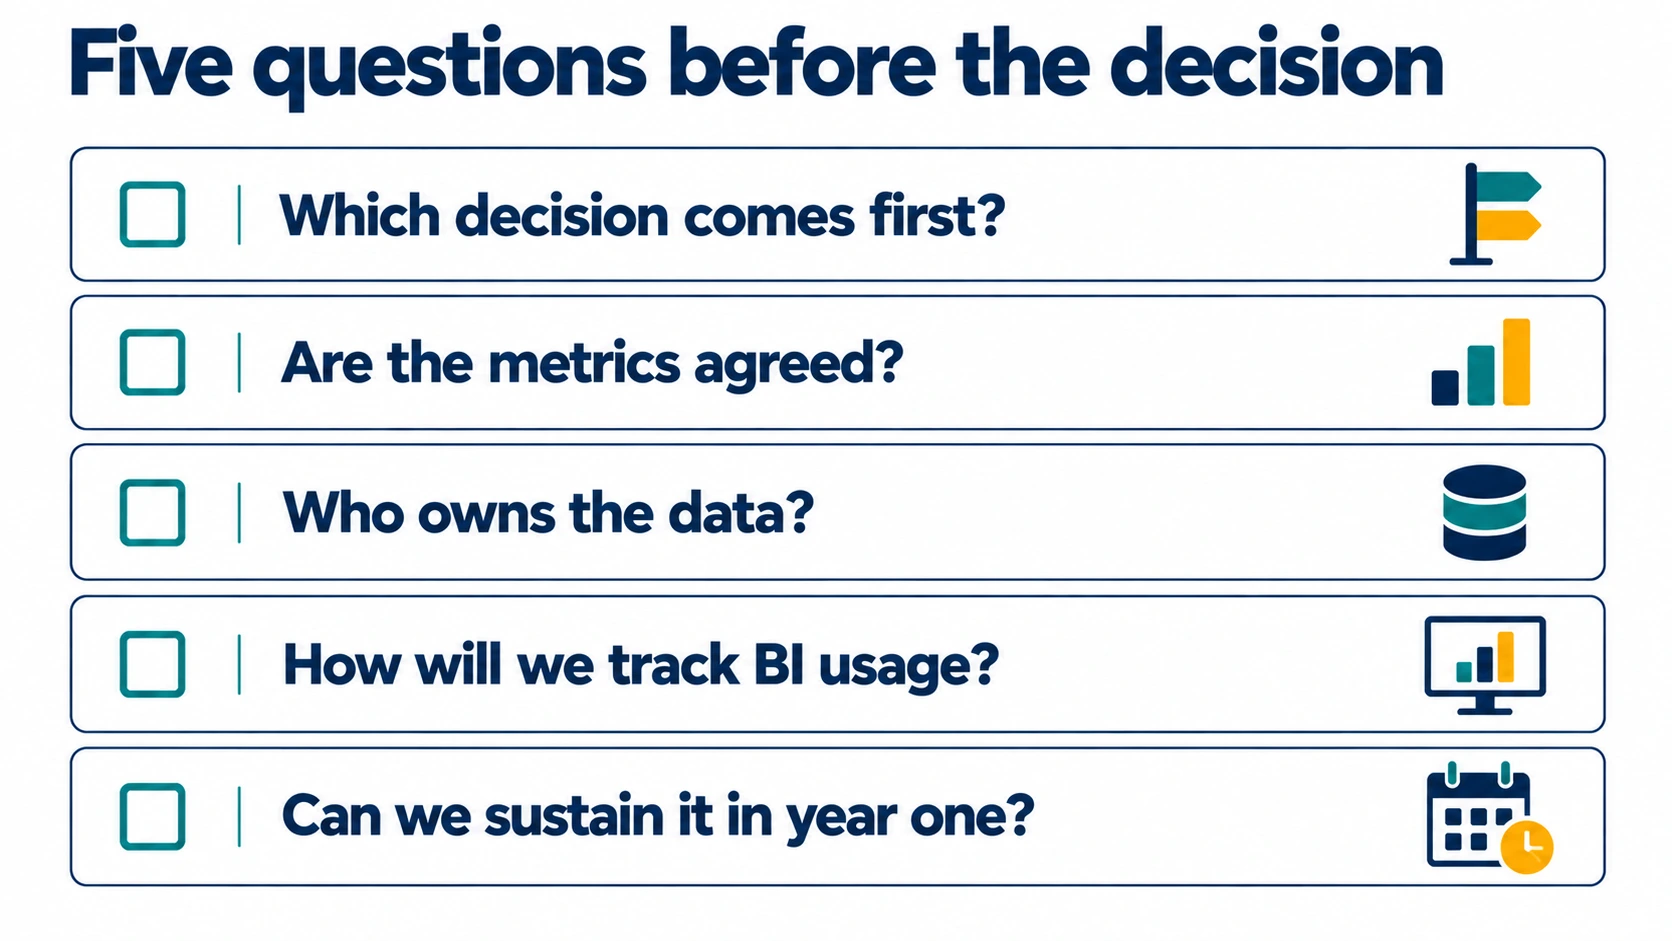
If adoption is not defined before purchase, every post-launch review turns into an interpretation. One team can point to published dashboards, another can point to continued Excel checks, and both can be technically correct. The issue is that “used” was never translated into observable behaviour.
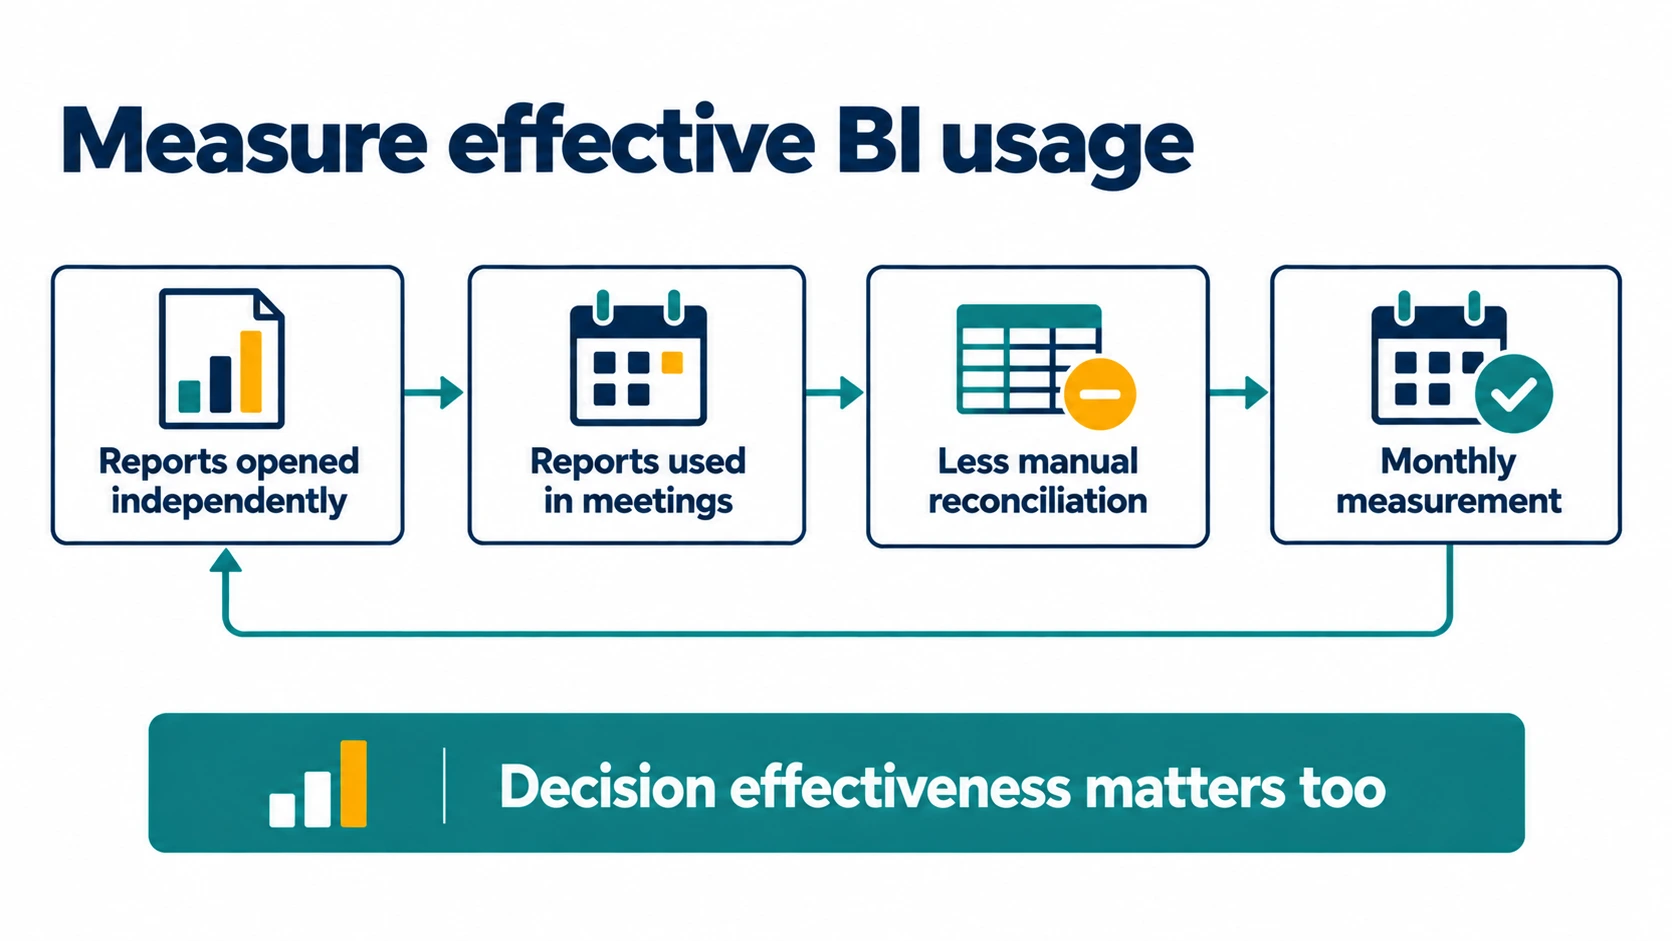
A better approach is to define adoption as repeated usage in real decision moments. That means leaders and managers open reports on their own, use them during recurring meetings, and rely less on manual reconciliations over time. This should be measured monthly from day one, so the business can see whether behaviour is actually changing or staying the same.
Most platforms already support this type of evidence. For example, usage metrics in Power BI let teams monitor report views, unique users, and page activity, which gives a practical baseline for adoption tracking instead of opinion-based assessment.
Operating effort has to be priced before purchase
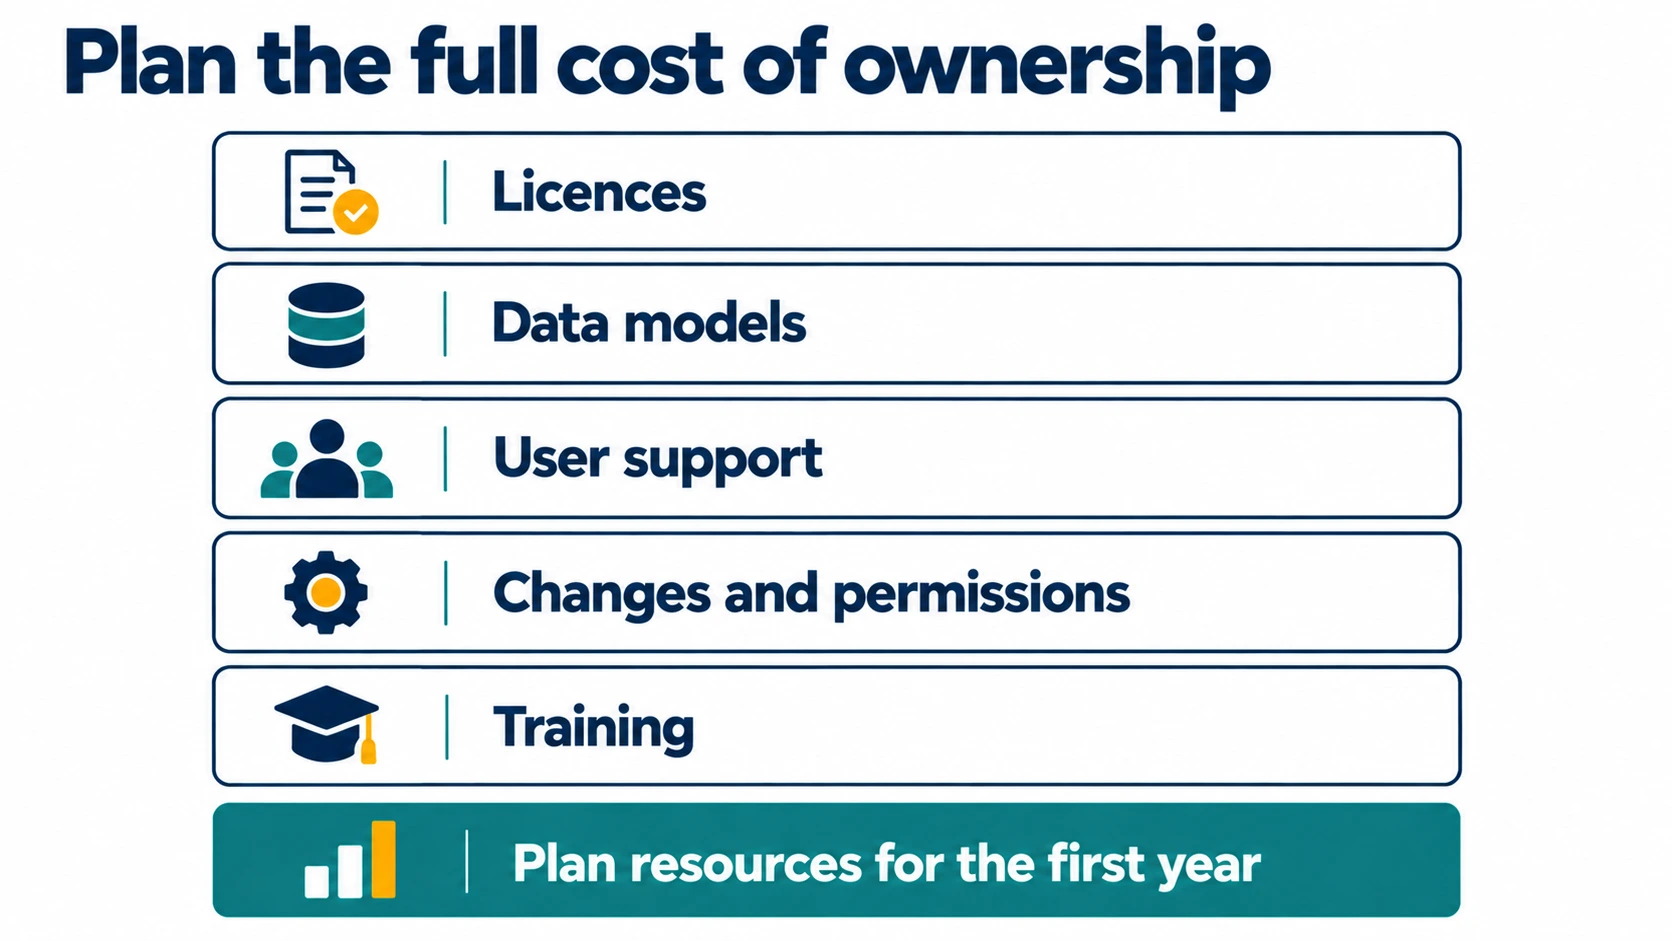
While license pricing is clear during procurement, operating effort is where most BI projects exceed their budget. Ongoing support, including data model maintenance, user permissions, and constant change requests, frequently consumes more resources than the software itself. In lean organisations, these tasks can easily overwhelm the analytics team if the platform’s complexity is underestimated.
A reliable evaluation must calculate the total cost of ownership across the first year, factoring in reporting growth and governance needs. You should test the platform against your internal staff’s technical capacity and your long-term plan for external partners. If an agency builds your initial dashboards, you need a clear strategy for how your team will handle the maintenance once that contract ends. Ultimately, the tool must be flexible enough to match your pace of business change without requiring constant, expensive manual updates.
What a strong final decision looks like
The goal of a good selection process is to ensure the focus stays on the business, not the technology. When you account for the operating effort and clarify governance from the start, the platform becomes a reliable part of the daily routine rather than a source of technical debt. Success is not measured by the features available on launch day, but by whether the team is still using the tool six months later to solve real problems.
By matching the tool to your internal capacity and your decision-making rhythm, you create an environment where data actually informs action. This practical approach transforms BI from a one-time purchase into a lasting asset that helps the company move forward with confidence. Getting the choice right means the technology eventually becomes invisible, leaving only the insights and the results behind.
Not sure how to balance your team’s capacity with the right tech? Let’s talk — we can find the best path forward for your data together.


Contact
Take your business to the next level with transparent business reporting
Choose a responsible partner with extensive experience who will provide real support for your team.