
In 2008, I defended my master’s thesis, entitled “Ensuring high Data Quality in Data Warehousing.” By then, I was already in my second year working as a BI developer and was looking for an interesting, “hot” topic. Even then, it was recognized that a sound decision-support system in a company had to be based on accurate, well-described and cataloged data, while data-loading processes (ETL) needed built-in mechanisms to prevent poor-quality data from being loaded and obscuring what was happening in the company.
It turns out that data quality keeps coming back like a boomerang and is still a hot topic in 2026. Today, I also see this return in the context of AI. My agents scanning industry news keep bringing me stories related to data quality. For example, in BARC’s “Data, BI & Analytics Trend Monitor 2026”, data quality management returned to the top spot in the ranking of 20 data, BI and analytics trends. It scored 7.9/10 — the same as data security and privacy.
The phrase “data quality” comes up often, and many people intuitively understand what it means. I decided to organize that knowledge and distill 20 years of experience into a concise form. The result is a guide for people who need to tackle the subject even though they do not work on the technical side of data.
Table of contents
1. What exactly is data quality?
The simplest way to assess quality is to ask whether the data is fit for the purpose for which we intend to use it. This approach, known as fitness for purpose, is also adopted by the UK Government Data Quality Framework. The same dataset may be sufficient for one process and inadequate for another.
A customer address without an apartment number may still be enough to assign a sale to the correct city. For parcel delivery, the same omission may make delivery impossible. Quality is therefore not a permanent label attached to a table. It results from the relationship between the data, how it is used and the consequence of a potential error.
A company does not need uniformly perfect data in every corner of its systems. Such a goal would consume a great deal of time, while its business value would be doubtful. Priority should go to information used in important decisions, reports and processes. For this information, it is worth defining the required level of quality, the person responsible and a method of continuous checking.
2. How can a manager recognize data quality problems?
Problems may become apparent outside a formal quality report as well. They can be seen in meetings, during the month-end close, in customer service and in everyday work with spreadsheets. Warning signs include:
- two reports show different values for the same metric;
- meetings begin by determining which number is correct;
- data has to be corrected manually in Excel before every use;
- reports are regularly reconciled with accounting;
- fields are empty or contain placeholder codes and entries such as “not available”;
- the same customer, product or supplier appears under several names;
- information arrives only after the decision has already been made;
- nobody can determine where a reported number came from;
- results change suddenly after a system migration or process change;
- AI answers are based on outdated or contradictory materials.
Each of these symptoms may also have an innocent explanation. Financial reconciliation can be a valid control, and a difference between reports may result from different reporting periods. Repetition is an important clue. If a team makes the same manual correction every month, the workaround has become part of the process.
A signal for managers: regular manual reconciliation of reports may mitigate the effects of an error, but it does not remove the cause. It is worth calculating the time spent on such corrections and tracing the data back to its source.
3. The key dimensions of data quality
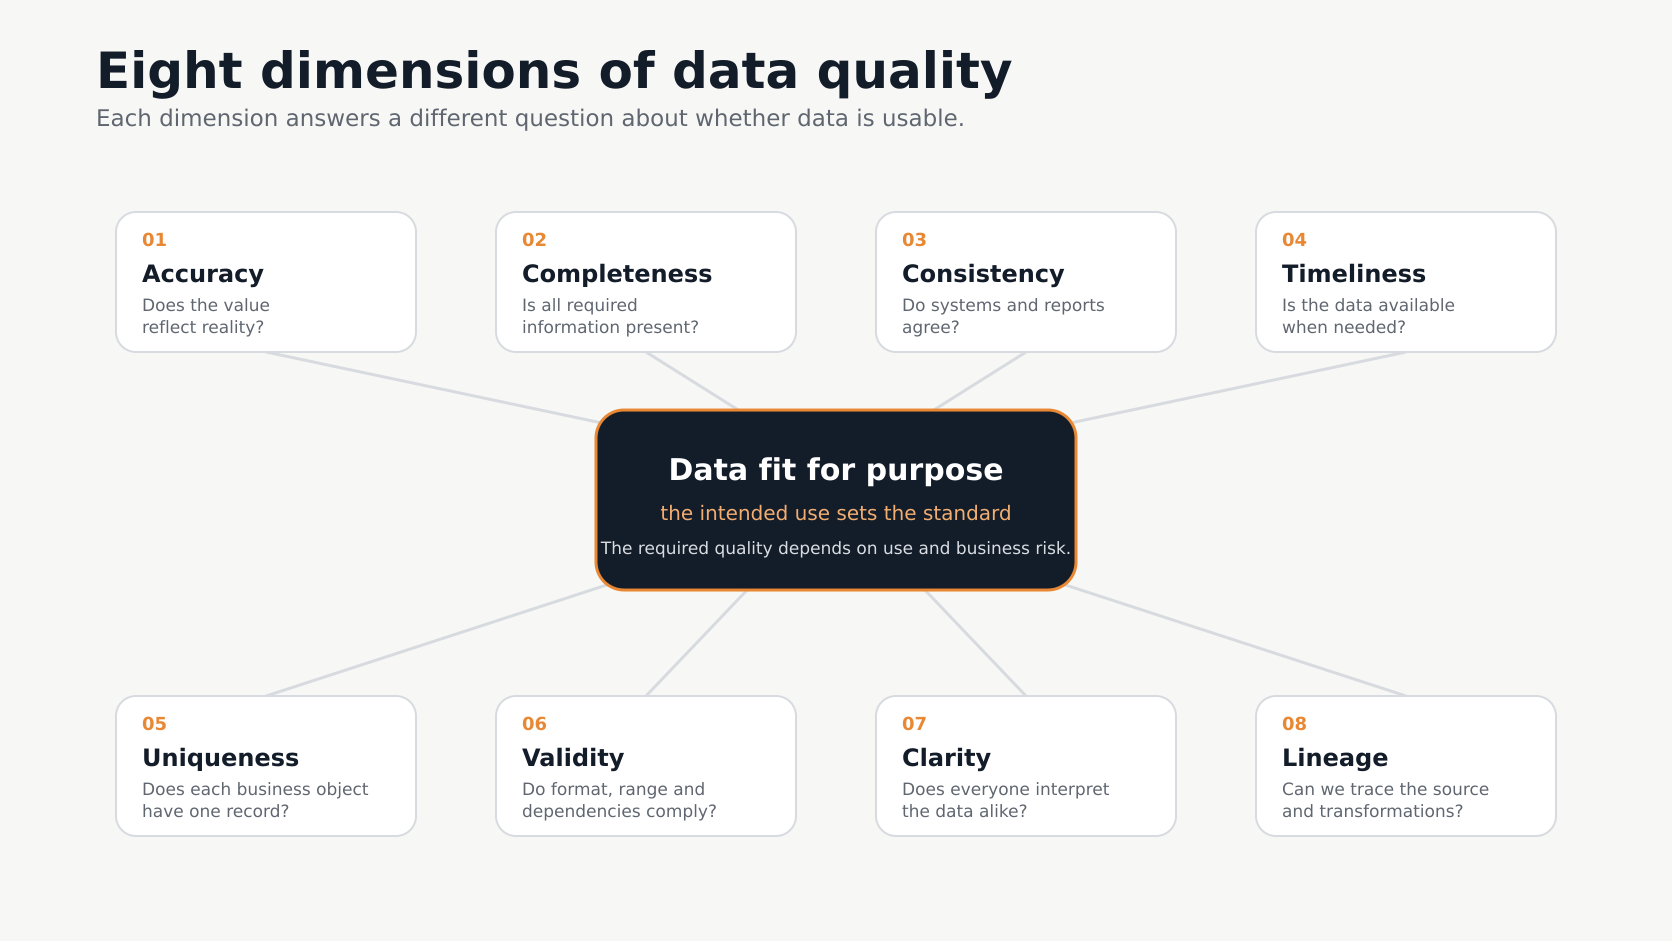
The general statement “our data is poor” is difficult to turn into action. Breaking quality down into several properties helps. The UK framework describes six core dimensions, and in management practice it is useful to add clarity of meaning and the ability to trace origin.
- Accuracy indicates whether a value corresponds to reality. A price may have the correct format but contain an extra zero. A tax identification number (NIP) may pass a character-count check even though it was assigned to a different company. Checking accuracy requires a credible reference point.
- Completeness indicates whether all required information is present. A missing customer region may prevent the customer from being assigned to a salesperson, while a missing completion date may make it impossible to assess timeliness. Required fields should follow from the process, because not every gap carries the same weight.
- Consistency means the absence of contradictions. If the same customer is active in CRM but closed in ERP, the company needs to establish which system has the authority to determine the status and when synchronization occurs.
- Timeliness answers the question of whether data is available when it is needed. An overnight inventory refresh may be sufficient for weekly purchasing plans but too slow for sales teams making decisions every few minutes.
- Uniqueness requires a single representation of each business entity. A customer created separately by several branches may have a fragmented purchase history, different credit limits and several account owners. Assessing duplicates requires an agreed key that identifies the customer.
- Validity checks the format, range and relationships between values. An end date should not precede a start date, and the number of units sold should not be negative. Passing such a check confirms compliance with the rule, but not correspondence with reality.
- Clarity and understandability concern shared meaning. “Sales” may mean order value, invoiced value or booked revenue. A metric name without a definition, formula, period and source leaves room for several valid interpretations.
- Traceability makes it possible to determine where data came from, how it was changed and where it went. This path is called data lineage. IBM’s straightforward explanation covers data sources, flow and transformations. For managers, what matters is being able to answer why a number in a report looks the way it does.
The last two properties are not part of the six-element list used in the UK framework cited above. They complement it because without shared meaning and knowledge of the data’s path, it is difficult to explain a discrepancy, find its cause and assess the impact of a change.
4. How does poor data quality affect a company?
The effects depend on where the data is used. Instead of looking for a single universal loss figure, it is better to examine the mechanism in each area.
Finance. An incorrect allocation of costs changes the view of profitability, while delayed data makes cash-flow forecasting more difficult. Different definitions of a metric prolong reconciliation. The cost includes both the risk of an incorrect result and the time people spend checking it.
Sales. Duplicate customer records split contact and purchase histories. Missing attributes weaken segmentation, while assigning a customer to the wrong salesperson distorts the view of that salesperson’s performance. The view of the sales process is credible only when stage definitions are shared and applied in a comparable way.
Production and logistics. Outdated inventory data may lead to a delivery promise the company cannot keep. An incorrect date or product code makes it harder to assess timeliness, availability and job profitability.
Management. When reports regularly contradict one another, people stop trusting them. Private spreadsheets, local definitions and manually corrected versions of the “right” result emerge. Decisions may then rely on experience even where the company has invested in reporting.
AI and automation. A system using an incomplete or outdated knowledge base may provide an answer based on the wrong material. If the output triggers further action without human review, the same error may be repeated many times. The scale depends on the architecture, permissions and scope of automation.
5. Where do data quality problems come from?
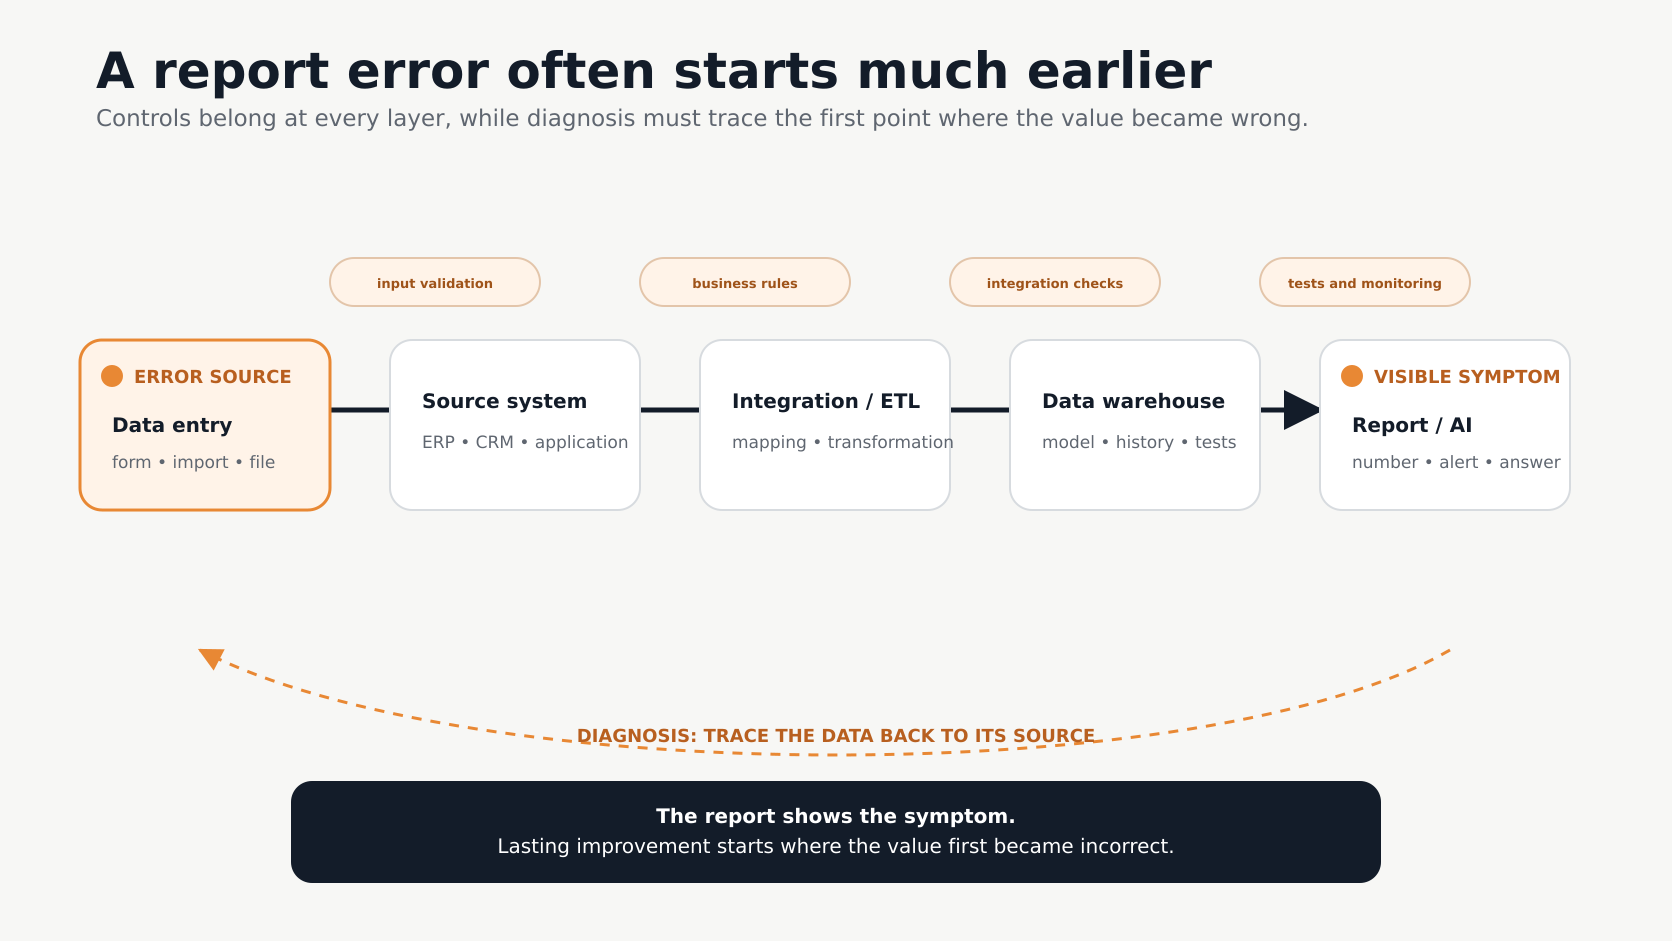
The place where an error is noticed may be different from its source. An incorrect margin may be visible on a management dashboard even though the cause lies in a product category in ERP, a mapping in an integration or a cost definition adopted several years earlier.
Typical sources of problems include manual data entry, missing validation, inconsistent definitions, several systems storing the same information, a lack of shared identifiers, migrations, files and manual exports, transformation errors, and process changes not reflected in reporting. Organizational gaps form a separate group: no named owner, unmaintained dictionaries and correcting the result only at the end of the flow.
The team should therefore trace the full path of the data. It is worth establishing where a value originates, who can change it, which systems it passes through and which rules operate along the way. A report shows the symptom. Diagnosis requires going back to the first place where the value became incorrect or lost its proper meaning.
6. Who is responsible for data quality?
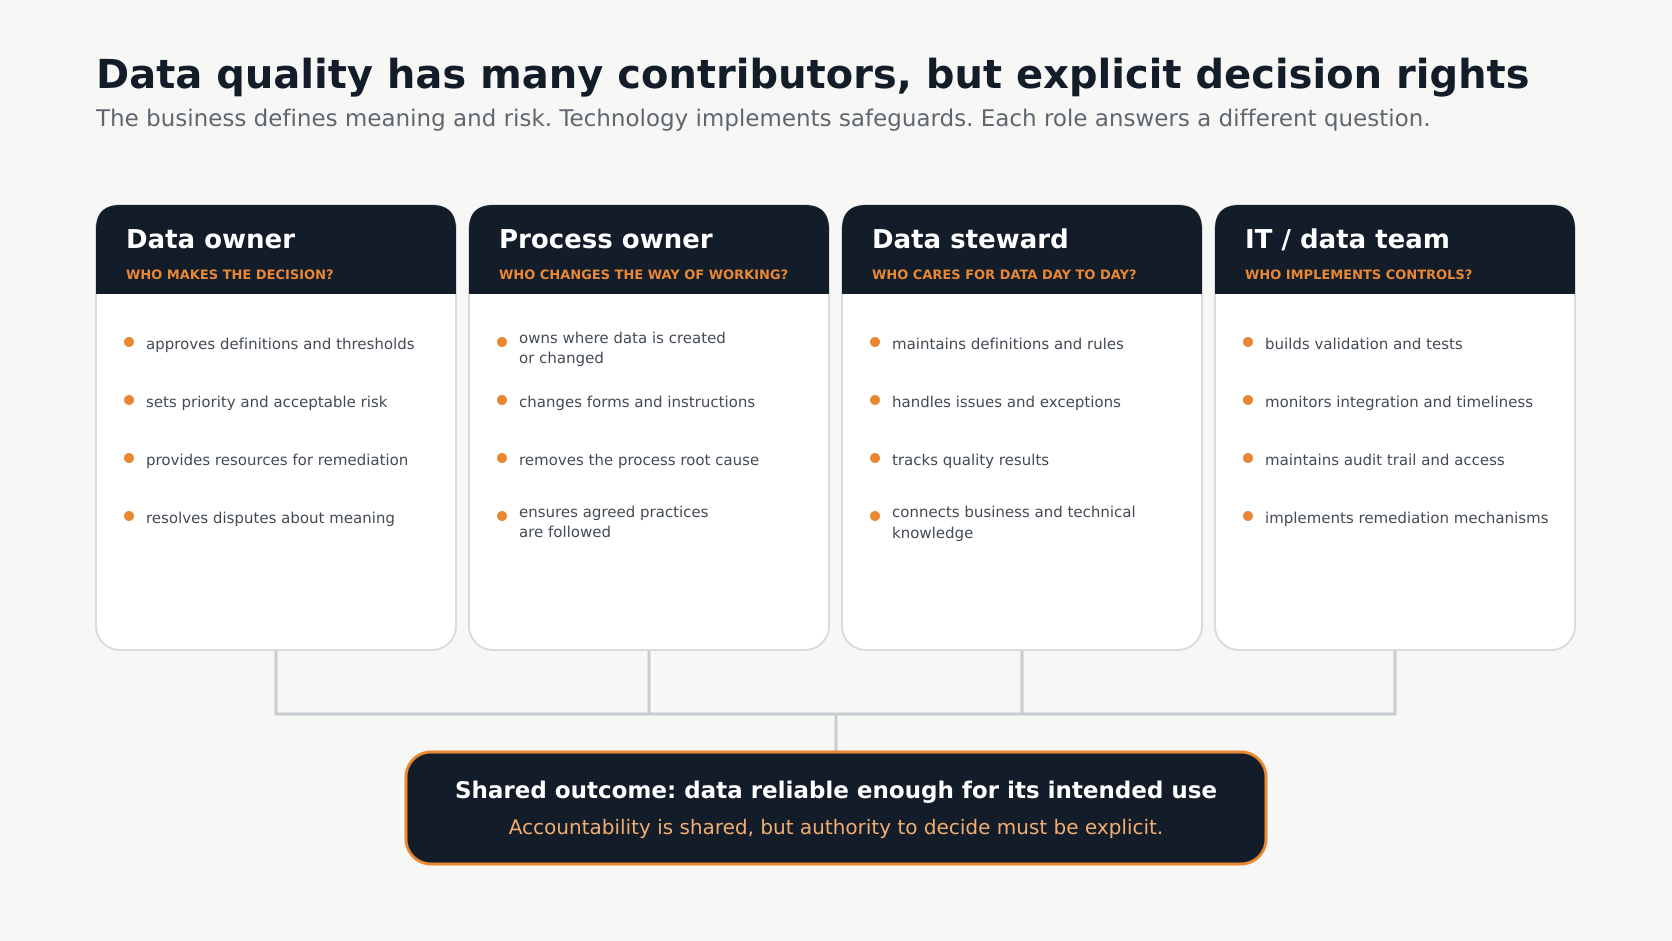
Data quality requires cooperation between business and technology. The IT team can implement validation, monitoring and secure data flows, but the business defines what a field means, how it is used and what level of risk is acceptable. The current data ownership model described by GOV.UK separates strategic, process, stewardship and technical roles.
- Data Owner is accountable for meaning, requirements and the acceptable level of quality in a given area. This person makes decisions, approves definitions and secures resources to address significant problems.
- Process Owner is accountable for how data originates or is updated. This person oversees working practices, instructions and the points in the process that affect quality.
- Data Steward takes day-to-day care of definitions, rules, documentation and reported issues. This person connects domain knowledge with the work of the technical team. The role may have a different title in a Polish organization, and in a smaller company its responsibilities may be handled by a business expert.
- IT or the data team translates requirements into validation rules, integrations, tests, monitoring and remediation mechanisms. It also ensures traceability of changes, access and reliable processing.
- Users report errors and describe their impact on work. Repeatedly correcting data outside the system should not, however, become their hidden responsibility.
An example division of responsibilities can be captured in a simple matrix:
| Data area | Data Owner | Process Owner | Day-to-day stewardship | Technical side |
|---|---|---|---|---|
| Customer | sales or customer service director | owner of the customer acquisition and service process | CRM expert | CRM and integration administrator |
| Product | product or production director | owner of product record creation | product data expert | ERP or MDM administrator |
| Sales | sales or finance director | owner of the order-to-settlement process | reporting expert | ERP, data warehouse and BI team |
Titles depend on the organization. What matters more is the explicit authority to make decisions: who approves a definition, who changes a process, who implements a rule and who responds when a threshold is breached.
7. Not all data is equally important
Trying to organize every table and field at once quickly dilutes the team’s focus. Priority should go to data that affects management decisions, financial results, reporting required in a given industry, automation, information provided to customers, and AI models and agents. Data present in many systems also deserves high priority because a discrepancy may affect several processes at once.
The concept of Critical Data Elements is useful here. These are fields, or logical groups of fields, that are particularly important for a specified use. Examples may include customer ID, Polish tax identification number (NIP), product code, product price and cost, order status, delivery date, and receivables balance. A name alone does not make a field critical. Its importance is determined by the impact of an error.
A useful test is to ask what will happen in the company if this value is incorrect, incomplete or one day late. The answer helps determine the order of work. A field of moderate quality that does not affect an important decision can wait. A small number of errors in data that controls payments or shipments may require an immediate response.
8. How can data quality be measured?
Measurement begins with a rule, scope and threshold. The statement “addresses must be complete” leaves many questions unanswered. The rule “at least 98% of active customers placing orders in a given month must have a postal code that matches the required format” specifies the population, period, property being checked and expected result. The threshold should reflect the risk, not an ambition to achieve a perfect database.
In practice, a company can track:
- the percentage of records with all required fields complete;
- the number of records or groups identified as duplicates under an agreed key;
- the percentage of values that comply with a format, range or dictionary;
- agreement of the same value across systems, using a shared identifier and comparison time;
- the time from data creation to its availability in a report;
- the number of manual corrections and reported incidents;
- the time taken to resolve a problem;
- the value of transactions affected by an error.
The last measure shows the nominal value of transactions affected by an error, not the loss incurred, cost or net exposure. Five invoices worth PLN 1 million in total and assigned to the wrong customer require a different analysis from one hundred missing phone numbers. The number of incorrect records alone does not determine priority.
A measure should connect the state of the data with a business consequence. It is useful to pair the completeness result with the labor time required to fill gaps. Pair the number of discrepant invoices with their value, accounting risk and correction time. Incident counts also require careful interpretation: an increase may indicate deteriorating data or more effective detection and reporting.
The point of reference is a baseline measurement performed under a documented rule. Subsequent results must use the same scope and calculation method. This allows the company to see a trend, assess a process change and distinguish improvement from a shift in definition.
9. Where should controls operate?
Effective protection has several layers. Each catches a different kind of problem and does so at a different point.
- At data entry, required fields, lists of allowed values, format checks, prompts and potential-duplicate detection are used. Early feedback allows users to correct an entry before it goes any further.
- In the source system, business rules, dictionaries, reference data, permissions and a change log are needed. The system should protect the most important relationships that can be defined unambiguously.
- During integration and loading, controls can check package completeness, control totals, identifier agreement and record-level rules. Errors should be logged, while defective data should be rejected, marked or sent to quarantine according to the risk.
- In the data warehouse and reporting layer, post-transformation consistency tests, comparisons with the source, change history, freshness monitoring and detection of unusual deviations are useful.
- On the user side, it is worth displaying the last refresh date, a quality result, a warning about a known problem and a simple reporting channel.
End-of-flow controls are still needed because they detect errors in transformations and combinations. Stopping a problem close to where it originates may, however, limit its downstream effects. The defective value then does not pass into further reports, exports and decisions.
10. What should be done with incorrect data?
Detecting an error triggers a decision about the response. The options are to block the save, reject the record, quarantine it, accept it with a warning, correct it automatically, verify it manually or consciously accept the risk. Each response has a cost and should be matched to the business consequence.
A missing phone number may result in a warning if the customer has chosen email as the preferred contact method. An invalid bank account number for an approved payee may justify holding a payment until verification. An unambiguous rule, an audit trail and reversibility reduce the risk of automatic correction, but safety also depends on the specific use and consequence. In other situations, automation may turn a visible error into an apparently valid value that is harder to detect.
Deliberate acceptance can also be rational. Repairing old, rarely used data may cost more than the benefit of improving it. Such a decision should have an owner, a rationale, a defined scope and a date for review. Otherwise, “acceptance” becomes a forgotten problem.
11. Fixing data or fixing the process?
Correcting a record restores the current data’s usefulness. Changing a dictionary, form, integration or working method reduces the creation of further errors. A mature response addresses both levels when the impact justifies the cost.
Imagine that the management accounting team corrects product categories in Excel every month. The report is finalized, but the next data load brings the same set of discrepancies. The source may be an outdated dictionary, a free-text field used when creating a product or an incorrect integration mapping. Only changing that element will stop the recurrence.
A useful cycle has six steps:
- detect and register the problem;
- assess its business impact;
- correct the current data when needed;
- find the first point where the error arose;
- change the process or system;
- measure again and check whether the problem recurs.
It is worth reporting the number of repaired records and the number of removed causes separately. The first measure describes the cleanup effort. The second reflects work to remove the sources of problems, but by itself it does not show their impact or the cost avoided. The result needs to be assessed together with recurrence, business impact or a separate cost method.
12. Where to start — a practical plan for managers
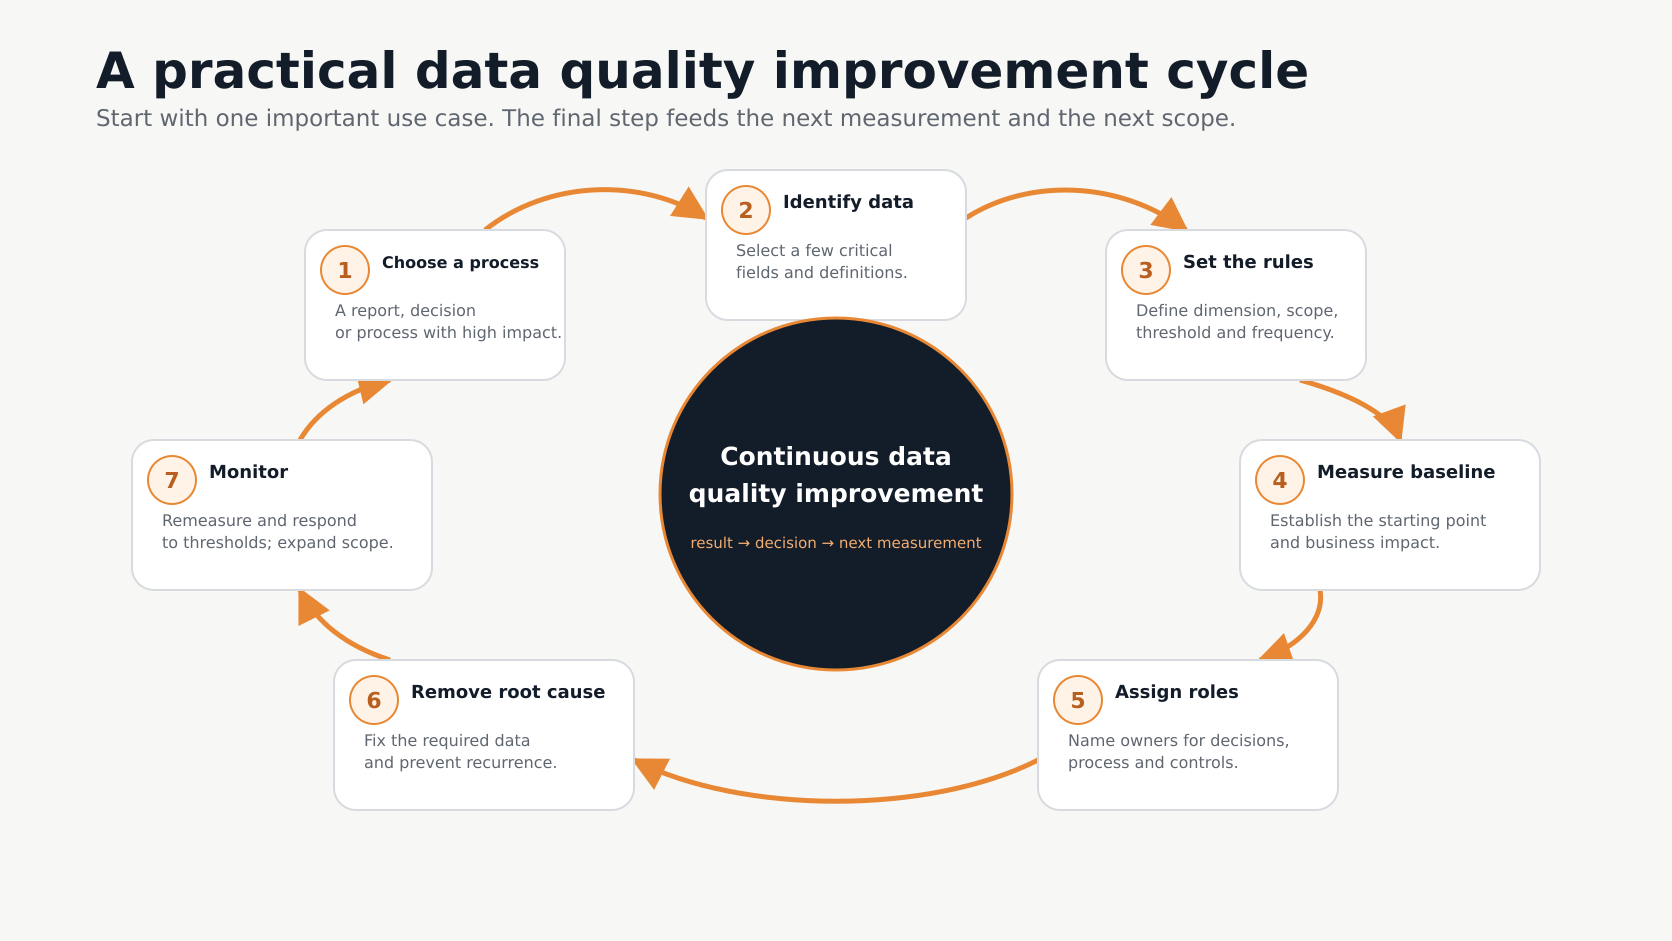
The following seven steps show how to move, within a limited scope, from complaining about data to an organized way of working with a clear connection to a decision or business result.
- Choose one important process or report. It may be a cash-flow forecast, margin report, order-handling process or the knowledge base used by an AI assistant. Describe the decision this area supports and the intended recipients of the output.
- Identify the key data. Instead of the entire model, select a few fields and definitions with the greatest impact. For a margin report, these may be product code, revenue, cost, currency and accounting period.
- Define the quality rules. For each element, record the dimension, population, calculation method, threshold and control frequency. Also establish the reference source when checking accuracy against reality.
- Measure the baseline and business impact. Measure the number of errors under the documented rule, the time spent on manual corrections, the value of affected transactions and the delays. Do not add these figures into a single, apparently precise amount without an agreed method.
- Assign owners. Identify the person who approves the definition and threshold, the Process Owner, the person handling reported issues and the team implementing the control. Also document the escalation path.
- Remove the highest-cost causes. Select problems according to impact, frequency and response cost. Correct the data needed now, then change the point where the error originates.
- Introduce continuous monitoring. Repeat the measurement under the same rule, set threshold alerts and discuss recurring problems with their owners. Once the first area is stable, the approach can be extended to the next.
This starting point allows the team to achieve measurable results: shorten reconciliation time, reduce the number of manual corrections, accelerate access to data or lower the value of transactions affected by errors. The program can be expanded only once the first scope is working and has owners.
13. Pitfalls in data quality projects
The following list describes recurring pitfalls and their mechanisms, not a ranking of how often they occur in companies.
- Covering all data. The scope grows faster than the organization’s ability to make decisions, and the team loses sight of the fields that matter to the business.
- Starting with a tool purchase. A platform can run rules and alerts, but it cannot determine the meaning of data, the threshold or the owner.
- Assigning everything to IT. Technology can implement a control, but it cannot independently decide whether a customer status or margin definition is right for the company.
- No measurable business goal. The number of tests grows, while the organization still does not know whether reconciliation time or risk has decreased.
- Corrections only in the report or data warehouse. The result looks better, but the defective data continues to feed other uses.
- No business owner. Disputes over definitions and priorities remain unresolved.
- Unmaintained dictionaries and rules. The offering or process changes, while the old control begins to generate false alarms or lets new errors through.
- Expecting perfection. The team spends resources on low-impact fields instead of managing risk according to use.
- No handling process for detected problems. Alerts multiply without triage, routing, a deadline or a responsible person, so users stop responding to them.
- Omitting source systems. The company keeps cleaning up the consequences while the cause remains in a form, instruction or integration.
14. Do you need a specialized tool?
At the beginning, a company can consider the resources it already has: control queries, a quality report, a documented list of rules, an issue register, owners and an alert when a threshold is breached, provided they fit the purpose, scale and existing environment. What matters most is the ability to run the same control repeatedly and retain a history of the result.
A specialized solution becomes more relevant as the number of sources and rules grows, controls need to operate continuously, and problems have to be routed to many owners. Profiling, a catalog and business glossary, lineage, reference-data management, quality scores and automatic notifications may then provide additional value.
Technologies differ in where they are applied:
- database mechanisms such as PostgreSQL constraints enforce rules close to where data is written;
- data tests in dbt check models after transformations in an analytics environment;
- Great Expectations allows teams working with Python, SQL and Spark to build validation suites and document the results;
- AWS Glue Data Quality combines rules and results and, in an ETL flow, also supports identifying and quarantining defective records in an AWS environment;
- Microsoft Purview Data Quality adds profiling, recurring scans, scores and alerts within its supported catalog.
These are examples of different layers, not a vendor comparison. Each solution has its own range of sources, limitations, costs and skill requirements. A company should begin with its goal, rules and responsibilities, then choose the smallest set of functions that can support the required scale. A tool speeds up an agreed workflow; business decisions remain with Data Owners and Process Owners.
15. Data quality in the age of AI
The problem of data quality existed long before today’s wave of generative AI. New uses have increased the importance of freshness, description, provenance and access control because a system may combine many sources, generate answers and — in some architectures — initiate further actions.
Before automating, it is worth establishing the level of data quality a specific use case requires. An employee knowledge base should have an owner, document effective dates, access controls and rules for withdrawing old versions. A model that evaluates submissions needs documented sources, label definitions, tests and monitoring of changes in the data. The NIST AI RMF Playbook connects AI governance with, among other things, quality, documentation, provenance, roles, monitoring and access to data.
Being able to cite a source in an AI answer makes checking easier, but the presence of a link alone does not prove the answer is true. The generative AI risk profile prepared by NIST describes confabulations, including false or incorrect citations that appear to provide support. The user or a verification mechanism should compare the claim with the actual source content.
The scale of the effect depends on how the system is deployed. NIST directly points to the possibility that AI systems can increase the speed and scale of harmful bias. For other errors, reach, permissions, automatic execution and safeguards matter. An assistant that prepares a proposal for a human user carries a different risk from an agent that independently sends messages or changes data in a system.
AI exposes old weaknesses: unclear definitions, outdated documents, absent owners and unknown provenance. At the same time, it forces a faster answer to the question of whether data is reliable enough for a given use. A model does not automatically improve the quality of the material it receives. It needs the same foundations as a management report: the right source, shared meaning, freshness and control.
16. A manager’s checklist
Before launching a larger program, it is worth answering ten questions:
- Do we know which data is critical to our most important decisions and processes?
- Do key metrics have unambiguous definitions, formulas and sources?
- Does every important group of data have a business owner?
- Is quality measured regularly under documented rules?
- Are the most important errors detected automatically?
- Do we know the sources of recurring problems?
- Do we remove causes rather than merely correcting records?
- Do users know where to report an error and what happens next?
- Is data used by AI subject to additional controls over freshness, access and provenance?
- Can we estimate the time, exposure and actual cost of poor quality as separate measures?
A few “no” answers are enough to define the initial scope. It is best to choose a question connected with an important report or process, assign a responsible person and set a date for the baseline measurement.
17. Summary
Eighteen years have passed since I defended my master’s thesis, and the basic problem remains familiar: a decision is only as reliable as the data and definitions on which it is based. The tools, the number of sources and the speed at which information is used have changed. AI has added new applications and the ability to repeat the effects of an error quickly.
Responsibility for quality brings business and IT together. The business establishes meaning, priority and acceptable risk. Technology implements rules, monitors the flow and helps with the response. Together, they need to measure the state of the data, remove causes and check whether the problem recurs.
The first step may be one critical report, process or set of fields. We select the most important data, document the rules, measure the baseline, assign owners and repair the sources of the most costly errors. The goal is data reliable enough to support a safe decision and available when it is needed.
Data quality resembles product and process quality. Inspecting the final result detects some defects. Lasting improvement comes when the entire process catches errors as early as possible, makes it possible to find their source and reduces their recurrence.
Sources and further reading
- BARC, “Data, BI & Analytics Trend Monitor 2026”
- UK Government Data Quality Hub, “The Government Data Quality Framework”
- UK Government Data Quality Hub, “Implementing a data quality action plan”
- GOV.UK, “Data ownership model”
- NIST, “AI Risk Management Framework”
- NIST, “Artificial Intelligence Risk Management Framework: Generative Artificial Intelligence Profile”